Global EV Battery Usage Reaches 844.2 GWh in January-August, Up 19.7% From a Year Earlier
TECHWORLD ·
✦ Resumen de IA
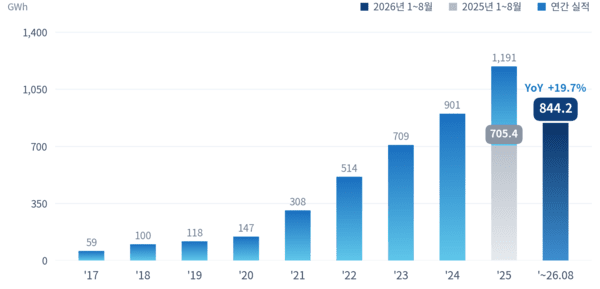
Battery usage for EVs registered around the world in January-August this year totaled 844.2 GWh, up 19.7% from a year earlier.
CATL remained No. 1 with 333.0 GWh, while BYD ranked No. 2 with 127.9 GWh.
LG Energy Solution ranked No. 3 with 68.3 GWh, SK On ranked No. 8 with 24.9 GWh, and Panasonic ranked No. 6 with 29.7 GWh.
According to SNE Research, battery usage in EVs, PHEVs, and HEVs registered around the world in January-August this year totaled 844.2 GWh, up 19.7% from a year earlier. Usage in August came to 116.8 GWh, rising 14.3% from the same month a year earlier. However, August's growth rate slowed from 23.3% in July, and the cumulative growth rate slipped below 20%.
By company, CATL retained the No. 1 spot with 333.0 GWh of usage, up 25.2% from a year earlier. Its market share rose 1.7 percentage points, from 37.7% to 39.4%. The increase was driven by CATL's expanded supply to overseas automakers.
BYD ranked No. 2 with 127.9 GWh of usage, up 6.2% from a year earlier. However, its market share fell 2.0 percentage points, from 17.1% to 15.1%. Its demand base was found to be centered on sales of its own vehicles.
CATL and BYD together held a 54.6% share. Their combined share a year earlier was 54.8%, meaning the pair's combined share was broadly similar to the previous year's level. However, the growth-rate gap between CATL and BYD continued.
LG Energy Solution, despite major customers such as Tesla, GM, Hyundai Motor Group, and Volkswagen, posted a lower increase than the overall market growth rate. LG Energy Solution's usage was 68.3 GWh, up 0.9% from a year earlier, and it held onto No. 3. However, its market share fell 1.5 percentage points, from 9.6% to 8.1%.
LG Energy Solution saw usage rise in Europe and Asia, but North American usage fell 42.3%, from 25.2 GWh to 14.6 GWh. As a result, the decline in North America mostly offset gains in other regions.
SK On's usage fell 14.5% to 24.9 GWh, and it remained in 8th place. Its market share dropped 1.2 percentage points, from 4.1% to 2.9%. Its customers include Hyundai Motor Group, Ford, Volkswagen, and Mercedes-Benz. The main reason for SK On's decline was the sharp drop in North American usage.
SK On's North American usage fell 41.8%, from 11.7 GWh to 6.8 GWh. In response, SK On wound down its joint venture with Ford and shifted to sole operation of its Tennessee plant. It is also pursuing the acquisition of LFP materials for its North American ESS business and accelerating efforts to find demand sources outside EVs.
Panasonic's usage rose 1.8% to 29.7 GWh, placing it in 6th place. Tesla's North American volumes supported Panasonic's usage, but its growth rate lagged the market average. As a result, Panasonic's market share fell 0.6 percentage points, from 4.1% to 3.5%.
Because Panasonic's customer base is centered on Tesla, sales trends in North America largely determine its performance. Accordingly, Panasonic is pursuing stabilization of operations at its Kansas plant while also considering a long-term plan to convert some production capacity to data center batteries.
By contrast, Chinese companies showed continued growth of around 30% across the upper ranks. CALB ranked 4th with 44.4 GWh of usage and 32.6% growth, while Gotion ranked 5th with 41.5 GWh of usage and 47.1% growth.
EVE recorded 29.5 GWh of usage, up 53.9%. SVOLT posted 22.0 GWh of usage, up 39.3%. REPT maintained 10th place with 20.3 GWh of usage, up 126.3%.
Chinese companies boosted their shares by expanding supply to commercial vehicles, ESS, and overseas OEMs, backed by domestic volumes and LFP cost competitiveness. The seven Chinese companies were made up of these five firms plus CATL and BYD, and their combined share was 73.3%. That was up 3.6 percentage points from 69.7% a year earlier. SNE Research cited domestic volumes, LFP cost competitiveness, and expanded supply to commercial vehicles, ESS, and overseas OEMs as the background for this trend.
In the rankings, Sunwoda in 11th place posted 19.3 GWh of usage, and the gap widened to 1.0 GWh. BYD's usage rose 6.2% from a year earlier. However, BYD's EV deliveries in China fell 33.6%, which was interpreted as limiting the pace of growth in overall usage.
By contrast, BYD's usage outside China rose from 23.8 GWh to 39.7 GWh, with growth of 66.5%. In August, BYD's overseas sales hit a new monthly high. The regions where its sales network expanded were Europe, Southeast Asia, and South America.
BYD is also expanding local production bases. Accordingly, it was projected that if the share of overseas sales rises, the impact of slower demand in China will diminish.
According to SNE Research, the global EV battery market continued to grow in January-August this year, with the increase rate coming in at about 20%. However, regional disparities widened. China grew 16.9% to 483.7 GWh, Europe grew 29.2%, and Asia excluding China grew 76.0%. South America grew 179.9%, while North America fell 23.7% to 73.1 GWh. North America contracted as demand remained weak after the end of the federal EV tax credit in the United States, and as a result, battery makers are increasingly shifting EV lines to ESS production.
Changes were also seen in product mix. The share of LFP rose 5.1 percentage points, from 52.2% to 57.3%, and battery capacity per vehicle expanded 11.9%, from 35.1 kWh to 39.2 kWh. This increase in installed capacity supported stronger usage growth than vehicle sales growth. Meanwhile, China began imposing a 2% consumption tax on lithium-ion batteries for domestic use in September, and it plans to abolish export VAT rebates for batteries in January next year. As a result, Chinese companies' pricing policies and the pace of their overseas production expansion were cited as variables in the competitive landscape through year-end.
Source: TECHWORLD · Lee Gwang-jae
Original: https://www.epnc.co.kr/news/articleView.html?idxno=407735
References
This article was produced with the help of an automated content generation algorithm.
Source: TECHWORLD
Ver originalThis article was summarized and organized by BizCrush based on the original article from TECHWORLD. For exact quotations and full details, please refer to the original article.